Bazaar Market
Visit bazaar.rocks Web Dev Full-stack commerce SvelteKitDjangoPostgreSQLTailwind CSS
A full-stack marketplace for used gear, vehicles, tools, and other high-value goods.

Systems + Software
I'm Rob Rothschild, a systems & software engineer in Bellingham, WA, focused on simulation, data analytics, and interactive tools for hardware and test systems.
Explore projects across C++ gameplay, Python and MATLAB data-analysis tools, and modern web apps built with Astro, Django, and SvelteKit.
Current Projects
A full-stack marketplace for used gear, vehicles, tools, and other high-value goods.
A custom dashboard for comparing collected test data against model predictions and engineering expectations.

An arcade-style C++ project focused on moment-to-moment control, collision, and responsive gameplay systems.

An interactive modeling and analysis dashboard built to make simulation outputs easier to inspect and compare.

An early client-facing website built to present a Pacific Northwest sculptor and quarry operation online.

NASA's Astronomy Picture of the Day
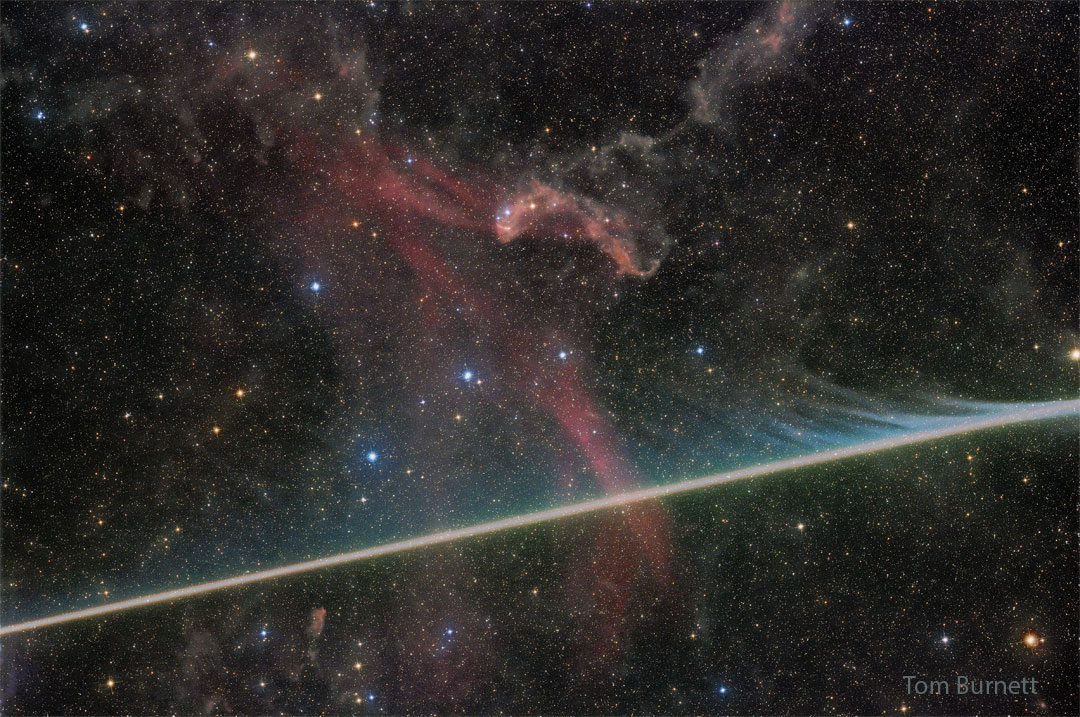
What's happening to this meteor? This bright meteor streak appeared and disappeared quickly during a long exposure of the Great Lacerta Nebula, seen faintly in red toward the center of the image. The meteoroid, likely a small pebble, creates its glow partly by heating and exciting surrounding air in Earth's atmosphere, but itself vaporizes and leaves wind-blown gas and dust with colors that give clues to its composition. The featured image was captured last month from Death Valley Observatories in Nevada, USA. This month, though, is particularly good for seeing meteors. Presently there are three meteor showers ongoing, although they are currently competing for visibility with the glow of a bright gibbous Moon. The most active of these showers, the Perseids, will be busiest in about 10 days -- after the Moon has dimmed considerably. This year, the Perseids peak nearly coincides with not only a new Moon, but, from some locations, one that totally eclipses the Sun. Sky Surprise: What picture did APOD feature on your birthday? (after 1995)